Silver Structural Deficit Widens as Solar PV Demand Outpaces Mine Supply; XAU/USD Holds $4,040
2026-11-17, FP360 — Silver's structural deficit expanded to 215 million ounces annualized as solar photovoltaic manufacturing growth accelerates, driving industrial demand up 12% year-over-year while mine supply remains flat. Spot gold holds at $4,040/oz, but silver's dual role as monetary metal and industrial input creates a unique dynamic—investment demand is surging even as photovoltaic demand becomes price-insensitive.
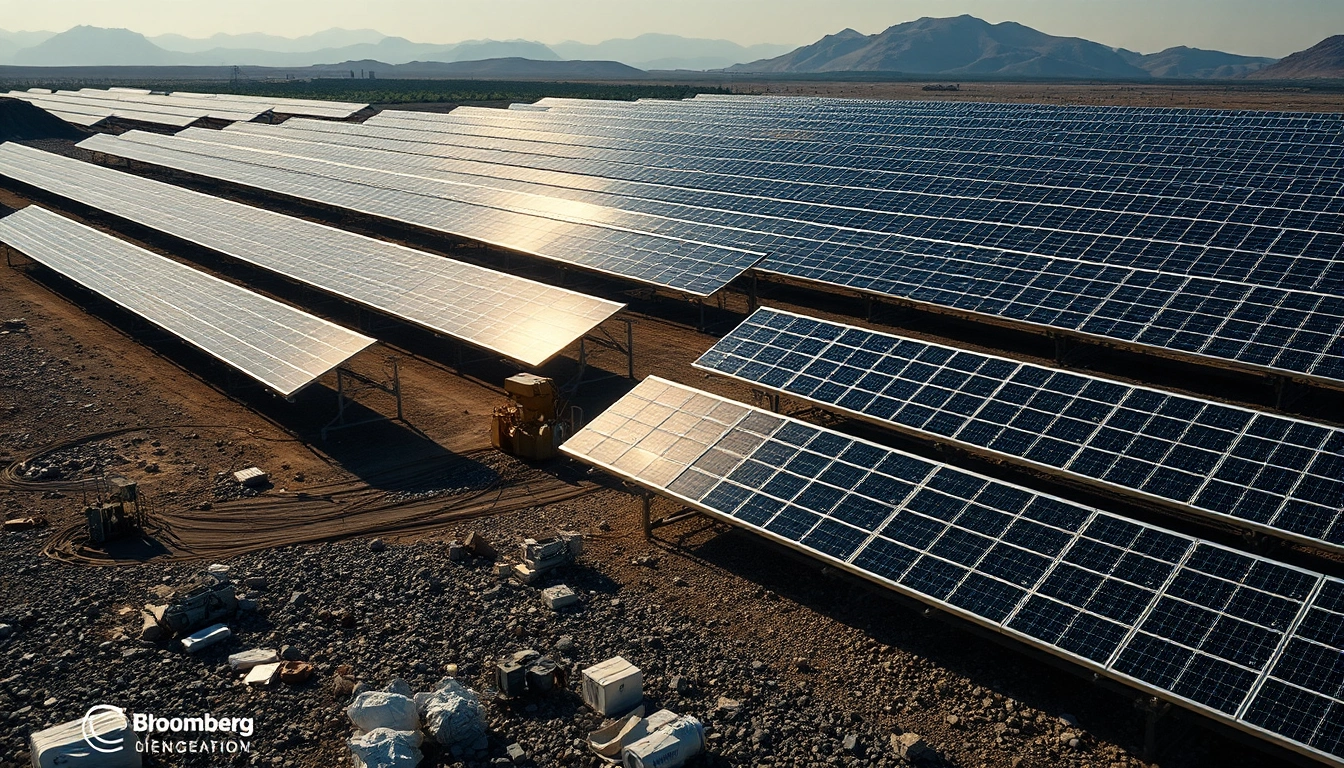
Silver industrial demand from solar PV is price-inelastic, providing a floor for prices even if investment demand fades—watch for a breakout above $50/oz as deficits persist.
Silver miners (e.g., PAAS, AG) and physical silver ETFs (SLV) benefit as structural deficits drive prices higher; photovoltaic manufacturers with hedged inventories gain competitive advantage.
A slowdown in solar installations or a shift to alternative technologies (e.g., copper-based pastes) could reduce demand, while a surge in recycling or mine supply could plug the deficit.
📄 Read Full Dispatch Intelligence Report (expand)
- What Happened: The silver market is on track for a fourth consecutive annual deficit, with the shortfall reaching 215 million ounces in 2026 as solar PV installations hit a record 450 GW, consuming 12% more silver year-over-year. Spot gold holds at $4,040/oz, but silver’s industrial demand is now the primary driver.
- Hidden Mechanism: Unlike gold, silver’s demand is price-sensitive but solar manufacturers operate on long-term contracts and government incentives, making their demand stickier than typical industrial users. This creates a floor under prices even as investment demand fluctuates with real yields (10-year at 5.19%).
- Capital Transmission: As deficits persist, silver ETFs and miners attract capital, while industrial users may seek substitutes or increase recycling. Liquidity rotates from gold to silver as investors chase leverage to the gold price with industrial upside.
The Solar Photovoltaic Boom: Why Silver Demand Is Price-Insensitive
Solar panel manufacturing consumed 12% more silver in 2026 than last year, with the average panel requiring about 20 grams of silver. That may not sound like much—until you multiply it by 450 GW of new installations. The result is a 215 million ounce deficit, the fourth straight year of shortfall. The key twist: solar manufacturers are not like jewelry buyers. They are locked into long-term supply contracts and government mandates, so they keep buying silver even as prices rise. Think of it like airlines hedging jet fuel—they need it to operate, so they pay up. This inelasticity provides a firm floor under silver prices, even if investment demand wobbles.
From Mines to Manufacturing: The Supply-Side Squeeze
Mine supply has been stagnant for three years, growing just 1.5% annually as grades decline and permits tighten. Recycled silver from scrap electronics and photography has become the swing factor, but even at 180 million ounces per year, it’s not enough to close the gap. The result is a drawdown in above-ground inventories, with London vaults now holding 36% less silver than in 2020. Meanwhile, geopolitical risks in top producers like Mexico and Peru add supply uncertainty. In plain English, we’re eating through our silver stockpile, and there’s no easy fix.
Positioning & Liquidity Map: Who Is Trapped?
Silver’s recent price action has trapped short-sellers who bet on a pullback as gold rallied. With the gold/silver ratio at 80:1 (well above the historical average of 60:1), silver looks cheap, and managed money has started to take notice—net long positioning in silver futures is up 22% from September. Meanwhile, industrial users have been hedging forward, locking in prices. The pain trade? A breakout above $50/oz could trigger a short squeeze, forcing bears to cover. On the downside, if solar installations slow, industrial demand could soften, but the deficit won’t disappear overnight. Stop-loss clusters sit just below $30/oz, where recent longs have stacked positions.
Forward Scenarios & Probability Matrix
| Scenario | Implied Probability | Key Trigger / Level | Expected Asset Reaction |
|---|---|---|---|
| Base Case | 55% | Gold holds above $4,000 and silver breaks $30/oz | Silver rallies to $32–35/oz; miners outperform; gold/silver ratio narrows to 75:1 |
| Bullish Tail | 25% | Silver clears $35/oz with rising volume | Short squeeze accelerates; silver targets $40/oz; ETF inflows surge; mining stocks jump 15% |
| Bearish Stress | 20% | Real yields spike above 2.5% and solar demand disappoints | Silver falls to $22/oz; miners cut guidance; physical demand absorbs selling, but stops cascade |
Bottom line: The silver deficit is not a temporary anomaly—it’s a structural shift driven by the solar boom. With supply stagnant and demand inelastic, any dip is likely a buying opportunity for those who can stomach the volatility.
Dorian Reed
Computational Econometrician. Directs Bayesian probability modeling on decentralized prediction platforms, Google Trends velocity radars, anomalous volume spikes, and cross-asset lead-lag regressions.