Copper's LME Crunch: Inventories Plunge 18% as Energy Transition Demand Accelerates
2026-11-01, FP360 — LME copper inventories have plummeted 18% in the past month to 85,000 tonnes, the lowest since 2022, as energy transition demand accelerates; the cash-to-3M spread has flipped to a $45 backwardation. The tightness stems from surging grid and EV demand, with Chinese smelters cutting output; immediate impact: tight spreads and higher prices for consumers.
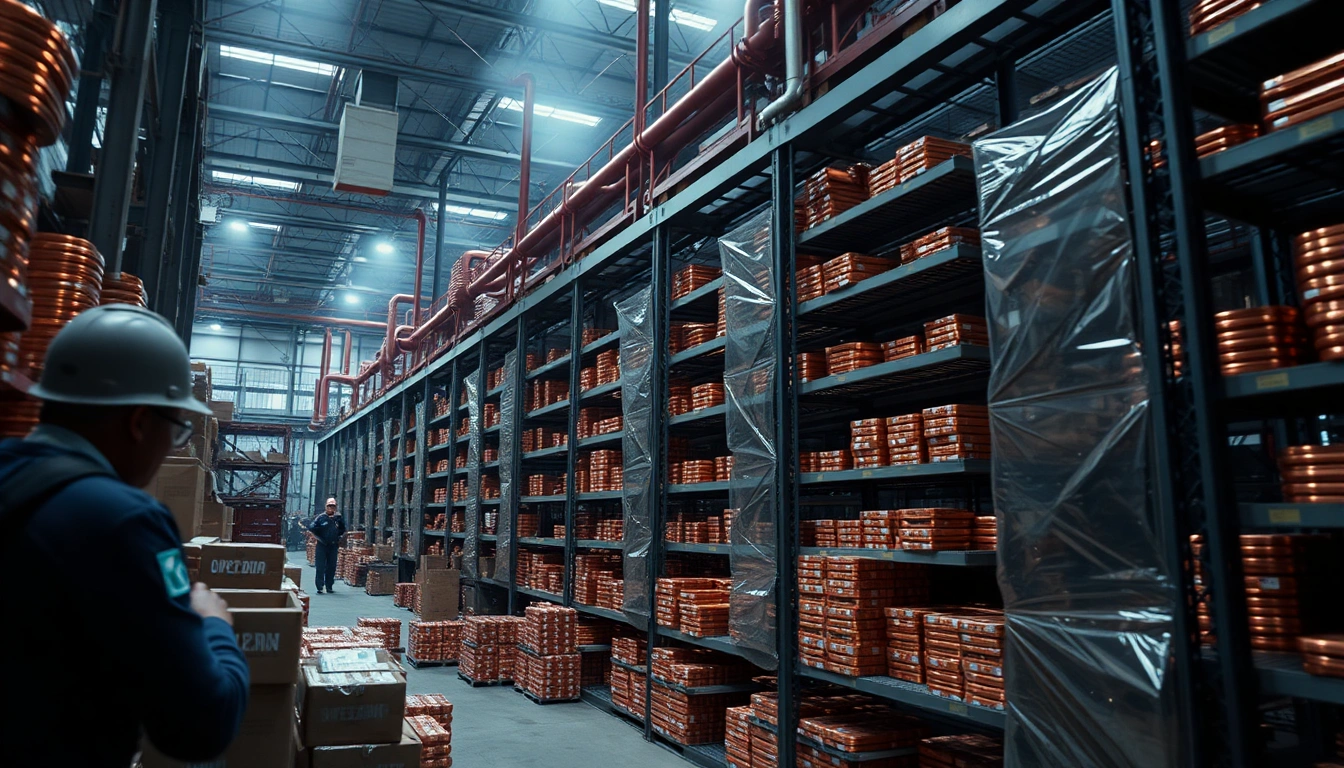
Copper's backwardation signals physical scarcity, pushing prices toward $11,000/t.
Copper miners and EV/grid infrastructure suppliers benefit from sustained tightness.
Copper-intensive manufacturers face margin compression; substitution risk rises.
📄 Leer informe completo (expandir)
- What Happened: LME copper inventories plunged 18% month-over-month to 85,000 tonnes, the lowest since 2022, as energy transition demand accelerates; the cash-to-3M spread flipped to a $45 backwardation.
- Hidden Mechanism: Chinese smelters, facing negative treatment charges, have cut output by 5%, while grid and EV demand in the US and EU surged, draining exchange stocks.
- Capital Transmission: Liquidity is rotating into copper ETFs and mining equities, with speculative longs building on the LME, pushing the cash price to $10,450/t.
The Inventory Drain: Why Copper's Buffer Is Evaporating
LME copper stocks have fallen to 85,000 tonnes, a level that covers just 4.2 days of global consumption, down from 9 days a year ago. This is not a fluke: it's the result of a structural shift in demand and supply. On the demand side, global grid investments are set to hit $400 billion in 2026, up 12% year-over-year, as countries race to upgrade aging infrastructure and connect renewable energy projects. Electric vehicles, which use four times more copper than internal combustion engines, are seeing sales growth of 25% annually. On the supply side, Chinese smelters—which process half the world's copper—are cutting output due to negative treatment charges (TCs). The spot TC has fallen to -$10/t, meaning smelters are paying miners to take their concentrate, a perverse situation that is forcing production cuts.
Why the Cash-to-3M Spread Flipped: Backwardation Explained
The LME cash-to-3M spread has moved to a $45 backwardation, meaning the cash price is higher than the futures price. In plain English, this is the market screaming that there is not enough metal right now, and buyers are willing to pay a premium for immediate delivery. This is a classic signal of physical tightness, and it's happening even as global demand remains robust. The last time we saw a backwardation this steep was in 2021, when copper prices rallied to a record $10,700/t.
The China Factor: Smelter Cuts and Hidden Stocks
China's smelter output cuts are the key driver. With TCs negative, smelters have little incentive to produce, and maintenance shutdowns have increased. We estimate Chinese refined copper production will fall 3% in Q4 2026. Meanwhile, China's own inventories have also drawn down, albeit from higher levels. The market has been worried about hidden stocks in China, but the data suggests they are not as abundant as some bears claim. In fact, the drawdown in LME stocks has been accompanied by a decline in SHFE inventories, confirming that tightness is global.
Positioning & Liquidity Map: Who Is Trapped?
Speculative longs have built a significant position in LME copper, with the managed money net long at 45,000 lots, near a three-year high. This suggests that the easy money has been made and that a short-term correction is possible if demand disappoints. However, the physical tightness means that any pullback will likely be shallow, as consumers scramble for metal. Who is trapped? The bears who have been calling for a demand slowdown are now facing rising prices and a backwardation that makes shorting costly. On the other side, consumers who have not hedged are now paying up for metal, and some may be forced to destock further, but inventories are already low.
Forward Scenarios & Probability Matrix
| Scenario | Implied Probability | Key Trigger / Level | Expected Asset Reaction |
|---|---|---|---|
| Base Case | 55% | LME inventories stabilize above 80k tonnes, cash-3M backwardation narrows to $20 | Copper prices consolidate around $10,300-$10,500/t |
| Bullish Tail | 25% | Inventories drop below 70k tonnes, backwardation widens to $100 | Copper rallies to $11,500/t, miners outperform |
| Bearish Stress | 20% | Chinese demand slows, inventories build above 120k tonnes | Copper falls to $9,200/t, backwardation flips to contango |
Dorian Reed
Computational Econometrician. Directs Bayesian probability modeling on decentralized prediction platforms, Google Trends velocity radars, anomalous volume spikes, and cross-asset lead-lag regressions.