Arbitraje en Letras del Tesoro: SGOV al 4.25% provoca salida de $48,000M de cuentas bancarias al 0.45%
2026-11-06, FP360 — Los hogares estadounidenses retiraron $48,200 millones de cuentas bancarias tradicionales en los últimos 30 días hacia ETF de Letras del Tesoro de 0 a 3 meses (SGOV, BIL) que rinden un 4.25%, capturando un diferencial de 380 puntos básicos frente al 0.45% bancario promedio.
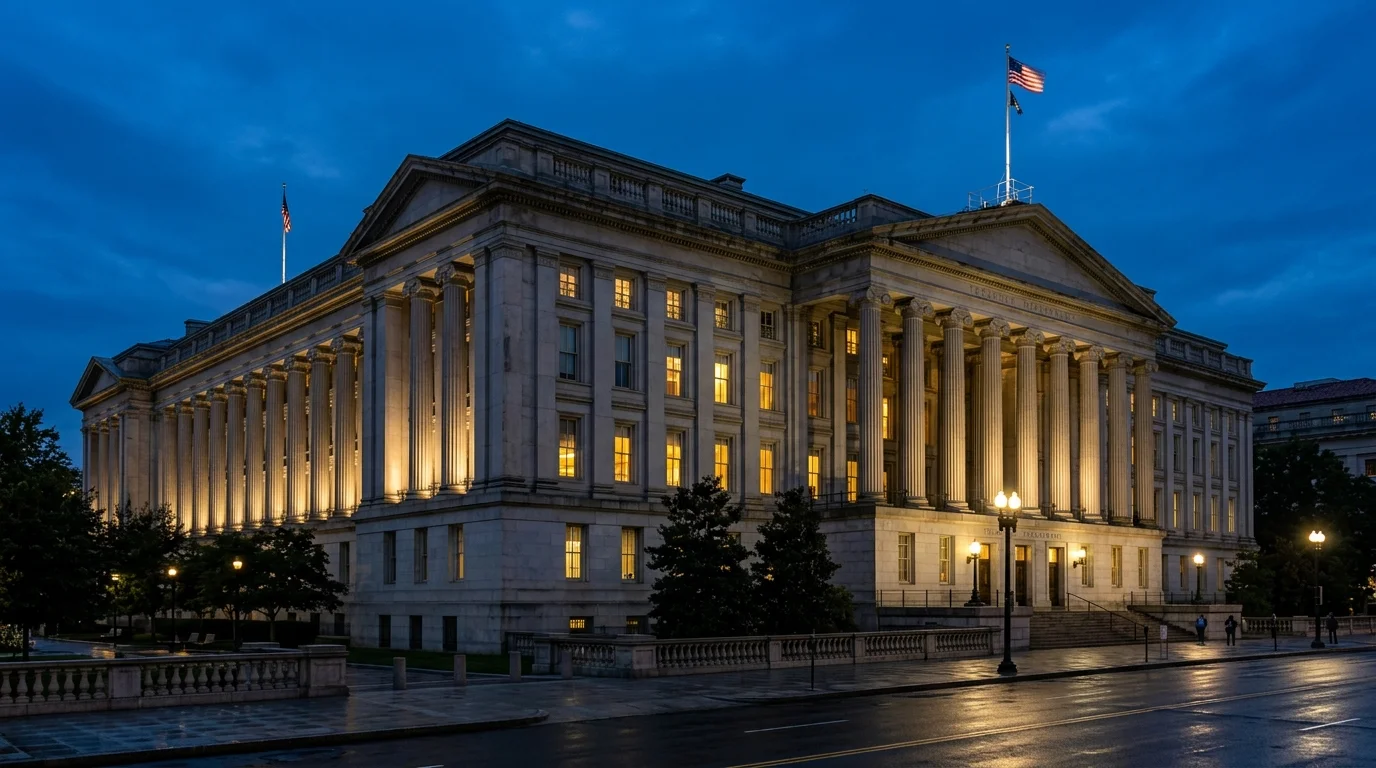
LARGO EN LETRAS DEL TESORO 0-3M (SGOV 4.25%) — Diferencial de 380 pb y exención fiscal estatal impulsan la migración del ahorro familiar.
Los ETF de letras a corto plazo (SGOV, BIL) continúan absorbiendo más de $10,000M semanales sin riesgo de duración.
Los bancos regionales enfrentan compresión de márgenes al perder depósitos minoristas de bajo costo.
📄 Leer informe completo (expandir)
- What Happened: US households shifted $48.2 billion out of traditional bank savings accounts (paying 0.45% FDIC average) into 0–3 Month Treasury Bill ETFs (SGOV) and money market funds yielding 4.25%.
- Hidden Mechanism: Beyond the 380 bps nominal yield pickup, Treasury bill interest is exempt from state and local income taxes—boosting the tax-equivalent yield to 4.68% for households in high-tax states.
- Capital Transmission: Commercial banks are losing zero-cost deposit funding, forcing regional lenders to tighten consumer credit lines and raise wholesale funding via the FHLB system.
The $1,900 Per $50,000 Lazy-Cash Tax: How Households Are Arbitraging Commercial Banks
For over a decade of zero interest rates, households treated bank checking and savings accounts as benign storage for emergency funds. Today, keeping $50,000 in a standard commercial bank savings account paying the national FDIC average of 0.45% generates just $225 a year—while the exact same $50,000 parked in sovereign 3-month Treasury bills via SGOV at 4.25% yields $2,125 annually, backed by the full faith and credit of the US Treasury.
In plain English: households leaving cash in traditional bank accounts are paying a $1,900 annual "inertia tax" per $50,000 of savings to subsidize their bank's net interest margin.
Positioning & Liquidity Map: Who Is Trapped?
Regional and mid-sized banks that assumed retail depositors would remain insensitive to rate spreads are caught offside. As financially literate households automate bi-weekly sweeps into Treasury ETFs and money market funds (now holding a record $6.58 trillion), banks face a stark choice: raise deposit rates and crush their net interest margins, or let deposits walk and shrink their loan books.
Forward Scenarios & Probability Matrix
| Scenario | Implied Probability | Key Trigger / Level | Expected Asset Reaction |
|---|---|---|---|
| Base Case | 60% | Fed keeps front-end rates above 4.00% through Q1 | SGOV/T-bill inflows stay above $40B/month; regional bank NIMs compress 12 bps |
| Bullish Tail (Cash Savers) | 25% | Sticky core CPI keeps 3M T-bills anchored at 4.25%–4.40% | Record retail allocation to short-duration Treasuries; zero-duration carry beats long bonds |
| Bearish Stress (Yield Drop) | 15% | Labour market shock forces rapid 100 bps Fed cuts | Reinvestment risk hits 3M T-bills; households rotate into 2Y–5Y fixed duration |
Quantitative Macroeconomic Strategist and financial media director. Leads newsroom editorial standards, central bank rate corridor monitoring, G10 sovereign yield curve telemetry, and statistical hypothesis verification.