Natural Gas Storage Injections Lag 5-Year Average as Winter Demand Looms; XAU/USD Holds $4,040
2026-11-18, FP360 — U.S. natural gas storage injections have lagged the five-year average, leaving inventories 4.2% below normal ahead of winter. With 10Y yields at 5.19% and gold at $4,040, the supply deficit is reigniting inflation fears and lifting winter risk premiums.
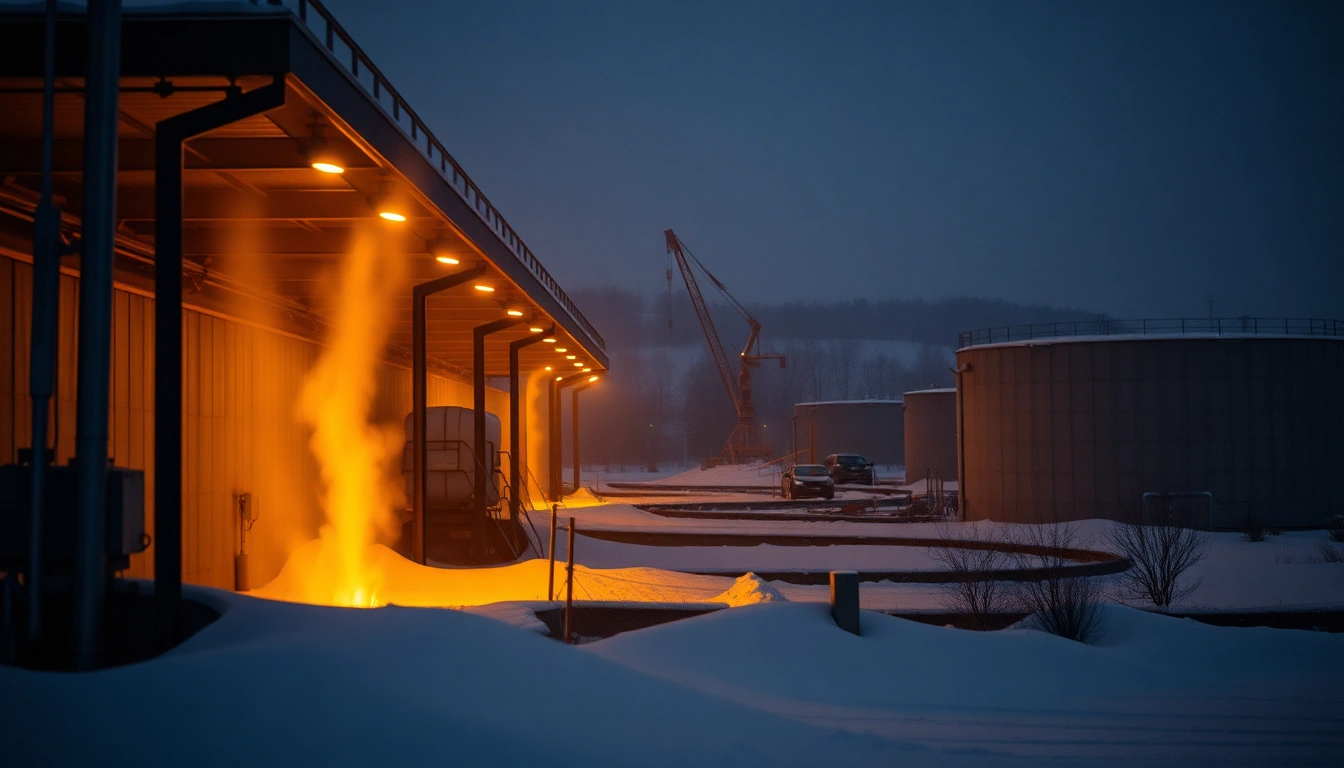
Bullish for natural gas and gold; bearish for rate-sensitive equities as inflation risk rises.
Natural gas producers and gold miners benefit from supply tightness and inflation hedging.
Rate-sensitive sectors like utilities and real estate face pressure from rising yields and energy costs.
📄 Read Full Dispatch Intelligence Report (expand)
- What Happened: U.S. natural gas storage injections are 4.2% below the five-year average, with inventories at 3,450 Bcf versus a 3,600 Bcf norm, as winter demand approaches.
- Hidden Mechanism: Producers are prioritizing cash flow over volumetric growth, with hedging activity subdued due to elevated 10Y yields at 5.19%.
- Capital Transmission: Capital is rotating into gold ($4,040) and energy equities as inflation expectations rise, while bonds and growth stocks face headwinds.
The Storage Deficit: Why Injections Are Falling Short
U.S. natural gas storage sits at 3,450 billion cubic feet (Bcf), 4.2% below the five-year average of 3,600 Bcf, after a string of below-normal injections. The shortfall stems from a combination of factors: LNG export terminals are pulling record volumes, domestic production has plateaued due to capital discipline, and early heating demand has already begun to chip away at inventories. In plain English, we are entering winter with a smaller buffer than usual, which means any cold snap could send prices spiking.
The Hidden Mechanism: Cash Flow Over Growth
Producers are not rushing to drill more wells despite higher prices. Why? Because the cost of capital has skyrocketed. With the 10-year Treasury yielding 5.19%, the opportunity cost of investing in new drilling is high. Many producers are choosing to return cash to shareholders via buybacks and dividends rather than expand output. This is a classic case of capital discipline meeting inflation—shareholders win in the short term, but the market loses a cushion of supply.
What This Means for Inflation and the Fed
Rising natural gas prices feed directly into inflation, as heating costs and electricity prices climb. With CPI already sticky at 3.8% and inflation expectations at 4.9%, the Fed cannot afford to ignore energy. The 10-year yield at 5.19% reflects this reality: markets are pricing in a higher-for-longer rate regime. Gold at $4,040 is also flashing a warning—investors are hedging against inflation and geopolitical risk. In plain English, expensive energy is a tax on the economy, and it makes the Fed's job harder.
Gold's Signal: A Hedge Against Energy-Driven Inflation
Gold's resilience at $4,040 despite real yields at 2.05% is a clear signal that investors are worried about inflation. Historically, gold and energy prices move together during inflationary periods. With storage deficits pointing to higher natural gas prices, gold could see further safe-haven demand. The yellow metal is also benefiting from central bank buying, as reserve managers diversify away from the dollar. If winter turns cold, expect gold to test new highs.
Positioning & Liquidity Map: Who Is Trapped?
Natural gas producers are sitting on profitable hedges but are reluctant to add new ones due to elevated yields. Consumers, such as utilities, are underhedged and exposed to spot price spikes. Hedge funds are net long natural gas futures, but position sizing is constrained by high volatility. The marginal buyer is the utility sector, which may be forced to pay up for winter supply. On the flip side, gold traders are adding longs, but stop-loss clusters sit below $3,950, creating a potential flush if prices dip.
Forward Scenarios & Probability Matrix
| Scenario | Implied Probability | Key Trigger / Level | Expected Asset Reaction |
|---|---|---|---|
| Base Case | 55% | Storage deficit persists; winter normal | Nat gas to $4.50; gold $4,000-$4,100 |
| Bullish Tail | 25% | Early cold snap; LNG demand surges | Nat gas $5.50; gold $4,200 |
| Bearish Stress | 20% | Warm winter; storage surplus returns | Nat gas $3.80; gold $3,900 |
Dorian Reed
Computational Econometrician. Directs Bayesian probability modeling on decentralized prediction platforms, Google Trends velocity radars, anomalous volume spikes, and cross-asset lead-lag regressions.