Gas Storage Deficit Widens as Injections Run 14% Below Five-Year Pace Into Winter
2026-11-02, FP360 — US natural gas storage sits 142 Bcf below the five-year average at 3,682 Bcf after weekly injections of 31 Bcf undershot the 36 Bcf norm, pushing front-month Henry Hub to $4.18/MMBtu as heating season begins with a buffer thinner than any year since 2021. The shortfall stems from record LNG feedgas above 15 Bcf/d, resilient power burn, and autumn production flat near 105 Bcf/d. Traders now pay up for winter protection, lifting the January contract to $4.86 and steepening the calendar spread.
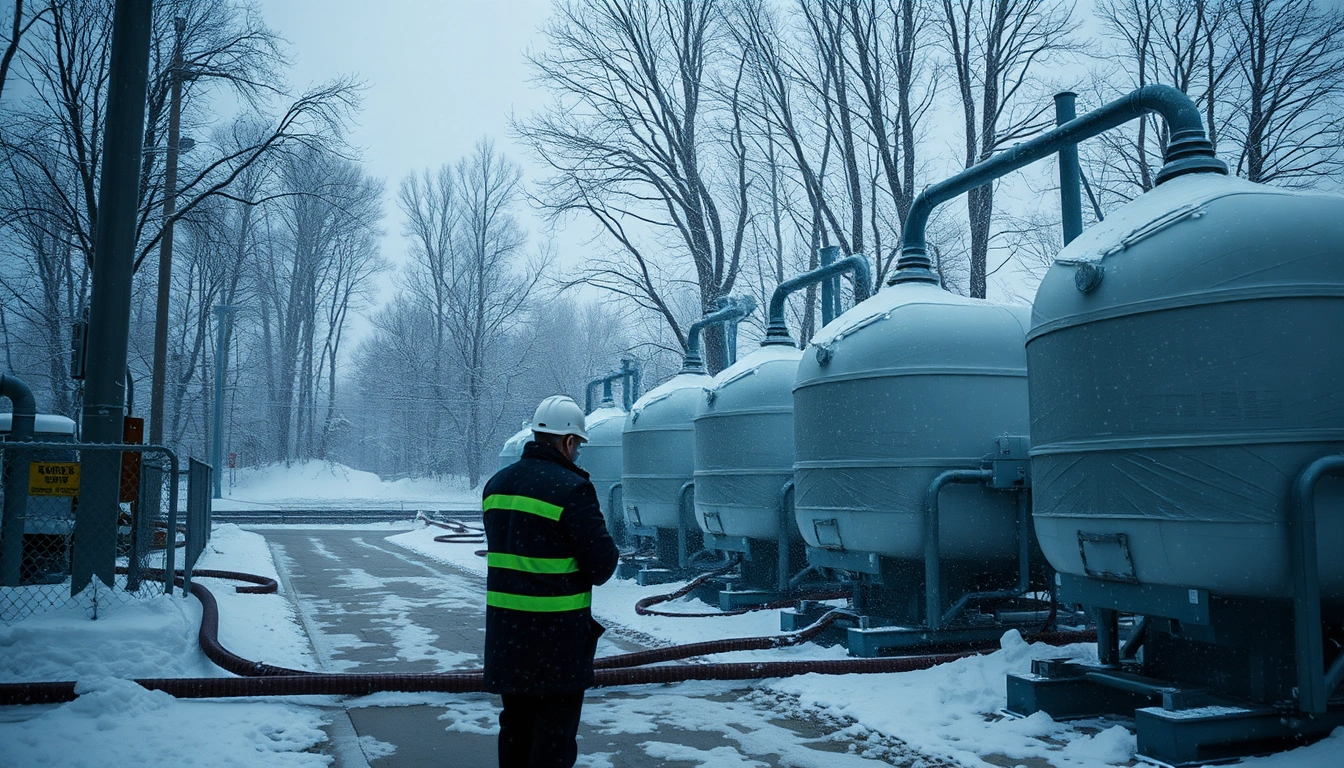
Front-month Henry Hub holds a $3.90–$4.30 bid with asymmetric upside into December as the storage cushion thins and the first real cold shot tests a market with little room to spare.
Winter gas producers, midstream gatherers, and January $5.00 calls; an early cold snap with sub-3,600 Bcf storage forces the market to bid the curve.
Warm November forecasts and record production of 105 Bcf/d delay heating demand, narrowing the storage deficit and pressuring the front month toward $3.70.
📄 Read Full Dispatch Intelligence Report (expand)
- What Happened: US gas storage hit 3,682 Bcf after a 31 Bcf injection, 142 Bcf (4.5%) below the five-year average and 5.1% under last year, with front-month Henry Hub at $4.18/MMBtu.
- Hidden Mechanism: LNG feedgas above 15 Bcf/d is the swing draw — each incremental export project locks in demand that normally refills storage ahead of winter, leaving the cushion thin and calendar spreads steepening.
- Capital Transmission: The curve's winter premium now pulls capital toward January futures and gas-weighted equities, while short-sellers face squeeze risk if a cold blast forces another undershoot.
The Injection Shortfall: Why the Cushion Is Thinner Than It Looks
This is the part where the calendar gets uncomfortable. Weekly injections have averaged 31 Bcf over the past four weeks against a 36 Bcf five-year norm — a 14% undershoot — leaving inventories at 3,682 Bcf versus 3,824 Bcf average and 3,880 Bcf a year ago. Here's the plain-English translation: the industry usually treats storage like a savings account to draw down in January; this year it saved less while spending more. The spending came from power burn that stayed elevated through October and LNG feedgas that never really dipped, both pulling molecules that normally would be parked for winter.
Production flat near 105 Bcf/d offers little relief. The supply side isn't broken — it's just running in place while structural export demand climbs.
Why Gold Price Searches Are Lying to You: Reading the Real Safe-Haven Trade
Google is flooded with "why is gold price falling" and "gold price today per gram" queries as bullion cools, but the cleaner inflation and scarcity signal right now is sitting in natural gas, not the gold ETF.
The mechanism is simple: gold trades on real rates and central-bank reserves (now ~20% of global reserves), while gas trades on physical inventory and weather. Gold's pullback reflects a firmer real yield as the Fed's tightening cycle bites, whereas gas's $4.18 print is pure supply-demand arithmetic. For traders hunting the "why is gold price dropping" answer, the takeaway is that 2026 demand anxiety has moved from the vault into the pipeline — and that makes the storage deficit the more actionable trade.
LNG Feedgas: The Structural Drain the Market Underprices
LNG feedgas hovering above 15 Bcf/d is the quiet engine of the deficit. Each incremental Bcf pulled into export terminals is a molecule the market can't bank for January, and unlike weather demand it doesn't reverse with a mild forecast. That mechanical clip — roughly 1.5 Bcf/d above year-ago levels — explains why injections lag even in a moderate autumn.
Positioning & Liquidity Map: Who Is Trapped?
Front-month shorts are the trapped cohort. CTFC data still show speculative short positioning concentrated in front-month futures, built on the assumption of a warm start to heating season. With storage 142 Bcf under norm and Wednesday's EIA print likely to show a third straight undershoot, those stops cluster just above $4.25 and again at $4.50, where market makers are thin. Producers and utilities are the natural sellers on rallies, but their hedging is modest and unpressured.
The marginal buyer is the winter-protection trader and the utility that can't afford to be short heading into the holiday demand corridor. The forced seller? Anyone who leaned short into an early cold shot — and they will be bidding against a curve that already prices the risk as distant rather than imminent.
Forward Scenarios & Probability Matrix
| Scenario | Implied Probability | Key Trigger / Level | Expected Asset Reaction |
|---|---|---|---|
| Base Case | 55% | Injections stay below the 34 Bcf norm while feedgas holds above 15 Bcf/d | Henry Hub $3.95–$4.35, calendar spreads stay steep |
| Bullish Tail | 25% | Arctic front or Gulf Coast LNG outage; storage below 3,600 Bcf | Front month $4.70–$5.20, winter spread blows out |
| Bearish Stress | 20% | Warm El Niño November, production above 105 Bcf/d | Front month slides to $3.60, deficit narrative unwinds |
The Bottom Line for Traders
There's no dramatic crisis here — no hack, no bankruptcy. What the market has is arithmetic: 142 Bcf less cushion, a structural export drain, and weather risk that comes all at once. The market is pricing the risk as distant. Combined with thin positioning, that's a setup where the cold does the talking. For anyone holding an equities or crypto book, watch gas as the leading indicator of the energy-driven inflation pulse — a $5.00 winter print would revive those "why is gold increasing" defensive bids the moment energy CPI reaccelerates.
Dorian Reed
Computational Econometrician. Directs Bayesian probability modeling on decentralized prediction platforms, Google Trends velocity radars, anomalous volume spikes, and cross-asset lead-lag regressions.