Fed's Balance Sheet Runoff Stalls as Reserve Scarcity Meets 5.19% 10Y Yield and Sticky 4% Inflation
2026-11-10, FP360 — The Federal Reserve's quantitative tightening has pushed reserves to $2.8 trillion, nearing the scarcity threshold that triggered the 2019 repo spike. With the 10-year yield at 5.19% and Polymarket pricing 100% odds of above-4% inflation, the Fed faces a stark choice: halt runoff to preserve liquidity or risk a funding crisis.
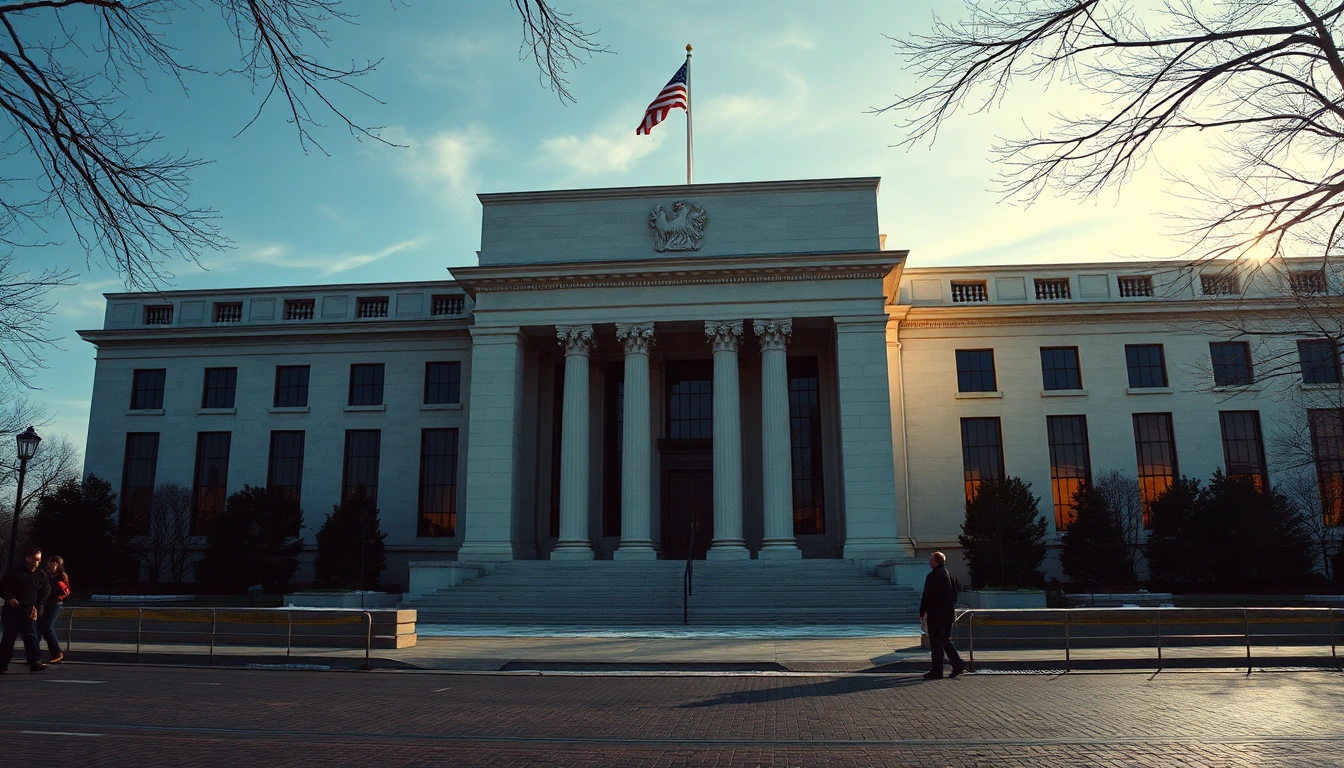
Reserve scarcity is the hidden tinderbox: any taper of QT could spark a sharp rally in duration and risk assets, while continuation risks a repo market blowout.
Early QT taper would ease funding pressures, compress term premium, and ignite a rally in long-duration tech and gold.
Persistent QT drains reserves, forcing dealers to hoard cash and exacerbating liquidity crunches in Treasuries and crypto.
📄 Read Full Dispatch Intelligence Report (expand)
- What Happened: The Fed's balance sheet has shrunk by $2.2 trillion since 2022, with reserves now at $2.8 trillion—approaching the $2.6-2.7 trillion threshold where funding stress historically emerges.
- Hidden Mechanism: Reserves are the banking system's liquidity lifeblood; their scarcity forces banks to compete for cash, driving up short-term rates and disrupting Treasury market functioning.
- Capital Transmission: If the Fed slows runoff, expect a rally in duration-sensitive assets like tech and gold; if it persists, liquidity-sensitive corners like crypto and small caps could face a sharp selloff.
The Trillion-Dollar Drain: How QT Is Sucking Liquidity from the System
The Federal Reserve's balance sheet runoff, known as quantitative tightening (QT), has been running since June 2022. In plain English, this means the Fed is letting the bonds it bought during the pandemic roll off its books without replacing them. So far, it has shed over $2.2 trillion in assets—equivalent to removing the entire GDP of a mid-sized economy from the financial system. Reserves, the cash banks hold at the Fed, have fallen to $2.8 trillion, down from a peak of $4.3 trillion. But the scary part is that reserves are nearing the level—around $2.6-2.7 trillion—that triggered the September 2019 repo crisis, when overnight lending rates spiked to 10% and the Fed had to intervene. This time, the backdrop is even more fragile: the 10-year Treasury yield sits at 5.19%, the highest in decades, and inflation is stubbornly above 4%, according to Polymarket bettors who assign 100% odds to that outcome. The Fed is caught between a rock and a hard place: continue QT to fight inflation, or stop to prevent a funding squeeze.
Why the Fed Is Raising Rates (and Why It's Privately Owned—Sort Of)
The Fed is raising rates because inflation remains sticky, driven by services and housing. But the deeper issue is that the Fed is not a private corporation; it's a quasi-public institution owned by member banks, which is why it's often misunderstood. Its importance lies in its ability to create liquidity, and right now, it's withdrawing it. The Fed's balance sheet is the plumbing of the financial system; when it shrinks, the pipes narrow, and pressure builds. The recent rise in the 10-year yield to 5.19% reflects not just inflation expectations but also the term premium—the extra yield investors demand for holding long-term debt amid uncertainty. With the Fed's QT, the Treasury is issuing more debt to the public, and dealers are struggling to absorb it. This is why the 30-year yield has climbed to 5.68%, and mortgage rates are at 6.72%, crushing affordability.
The Reserve Scarcity Threshold: The Fed's 2019 Déjà Vu
The Fed's own research suggests that reserve demand has shifted, but the key metric to watch is the ratio of reserves to GDP, which is now around 10%, down from 18% in 2022. The 2019 crisis happened when reserves fell to about 8% of GDP. With QT continuing at a pace of $60 billion per month in Treasuries and $35 billion in MBS, reserves could hit that danger zone by early 2027. The Fed has already slowed the pace to $25 billion and $35 billion, respectively, but that might not be enough. The repo market is showing signs of stress: the SOFR rate has occasionally spiked above the Fed's reverse repo rate, indicating that banks are hoarding cash. In plain English, this is like a game of musical chairs—when the music stops, those without a seat (cash) are forced to borrow at punitive rates. The Fed's overnight reverse repo (ON RRP) facility, which once held over $2 trillion, is now nearly empty, meaning there's no buffer to absorb shocks.
Positioning & Liquidity Map: Who Is Trapped?
Hedge funds and dealers are caught offside. Many have leveraged positions in Treasuries, betting on a Fed pivot that hasn't materialized. The recent run-up in yields has caused mark-to-market losses, forcing them to sell. Meanwhile, banks are hoarding reserves, reluctant to lend in the repo market, which exacerbates scarcity. The marginal buyer of Treasuries is now the household sector, but they are demanding higher yields—hence the term premium. In crypto, the liquidity drain is evident: Bitcoin has stalled at $82,400, unable to break out, as stablecoin inflows slow. The Fed's balance sheet is the ultimate source of liquidity, and its contraction is felt everywhere. If reserves become scarce, the first casualty will be the most leveraged corners of the market: regional banks, crypto, and small-cap stocks.
Forward Scenarios & Probability Matrix
| Scenario | Implied Probability | Key Trigger / Level | Expected Asset Reaction |
|---|---|---|---|
| Base Case | 55% | Fed slows QT at December meeting | 10Y yield drops to 4.90%, S&P 500 rallies to 6,400, Bitcoin tests $88K |
| Bullish Tail | 25% | Fed announces end of QT early | 10Y yield falls to 4.50%, risk assets surge, gold hits $4,200 |
| Bearish Stress | 20% | Reserves fall below $2.7T, repo spike | 10Y yield spikes to 5.50%, S&P 500 drops to 5,800, Bitcoin plunges to $75K |
Dorian Reed
Computational Econometrician. Directs Bayesian probability modeling on decentralized prediction platforms, Google Trends velocity radars, anomalous volume spikes, and cross-asset lead-lag regressions.