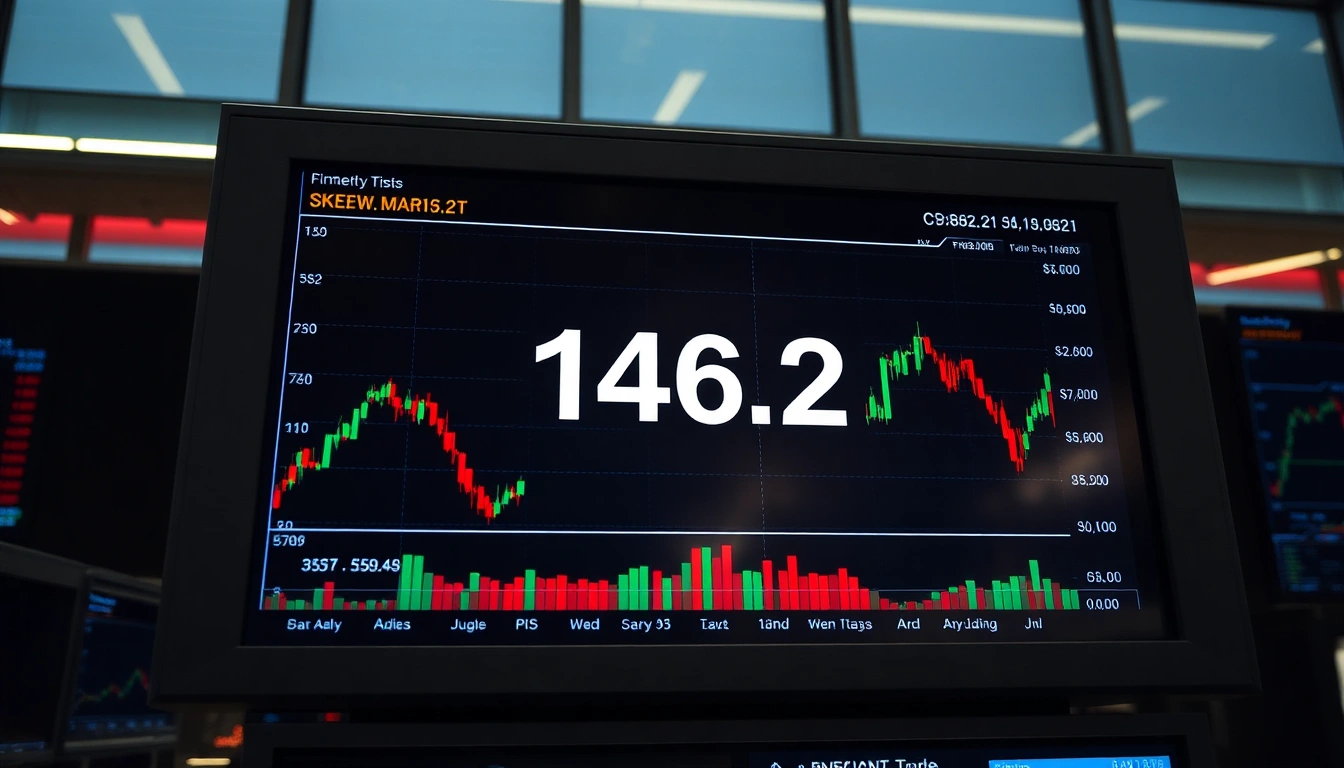
- What Happened: The CBOE SKEW Index spiked to 146.2 (+2.7σ) while spot VIX remained at 35.9, indicating a surge in institutional demand for tail-risk protection.
- Hidden Mechanism: The divergence between SKEW and VIX reveals a structural asymmetry: dealers are short deep OTM puts, forcing them to hedge gamma, which can amplify spot moves if volatility rises.
- Capital Transmission: Capital is rotating into defined-risk strategies like collars and put spreads, while unhedged equity exposures face rising costs, pressuring leveraged players.
The Calm Before the Storm: Why SKEW and VIX Are Divering
The CBOE SKEW Index, which measures the cost of tail-risk hedges relative to at-the-money options, has surged to 146.2—a reading only seen during periods of acute institutional anxiety. Yet the VIX, the market's headline fear gauge, sits at 35.9, elevated but not panicked. This divergence suggests that while the average investor remains complacent, sophisticated desks are quietly buying insurance against a black swan event. Historically, such SKEW spikes have preceded episodes of sudden liquidity-driven sell-offs, as dealers who are short these tail hedges are forced to dynamically hedge their exposure, exacerbating spot volatility.
Market Today: What's Driving the Divergence?
Despite major indices showing modest declines, the underlying demand for downside protection is intense. Institutional investors are actively purchasing deep out-of-the-money puts on the S&P 500 and other major indices, driving up the SKEW. This is not a broad-based panic but a targeted hedge against a specific risk: a liquidity event that could trigger a cascade of margin calls. The search for "why is the stock market down today" misses the nuance—it's not a sell-off but a repositioning. The market is up or down depending on the lens: headline indices are flat, but the cost of protection is soaring.
The real story is not the level of SKEW but the speed of its ascent. A 2.7-sigma move in a week indicates that institutional investors are not merely hedging; they are scrambling to rebalance portfolios ahead of potential year-end liquidity crunches. This preemptive hedging can create a self-fulfilling prophecy: as more institutions buy puts, dealers sell volatility to hedge, temporarily suppressing VIX and encouraging complacency—until the next shock.
Positioning & Liquidity Map: Who Is Trapped?
Hedge funds and proprietary trading desks that are short volatility via strategies like put-writing or VIX futures are now underwater, forced to buy back hedges at elevated prices. Meanwhile, retail investors using leveraged ETFs and margin accounts face the risk of forced liquidation if volatility spikes. The marginal buyer of protection is likely pension funds and endowments, which are locking in gains by collaring equity positions. The marginal seller of protection—dealers—are now short gamma, meaning they will need to sell futures as markets fall, accelerating downside moves. Stop-loss clusters are likely just below recent lows, where a break could trigger a cascade.
Forward Scenarios & Probability Matrix
| Scenario | Implied Probability | Key Trigger / Level | Expected Asset Reaction |
|---|
| Base Case | 55% | SKEW remains elevated but VIX stays below 40; S&P 500 holds 4,200 support | Range-bound trading with elevated volatility; defensive sectors outperform |
| Bullish Tail | 25% | VIX drops below 30; SKEW declines as hedges unwind | Relief rally in growth stocks and credit; volatility risk premium compresses |
| Bearish Stress | 20% | VIX spikes above 45; S&P 500 breaks 4,200 | Accelerated selling in high-beta names; dealers' gamma hedging amplifies move |