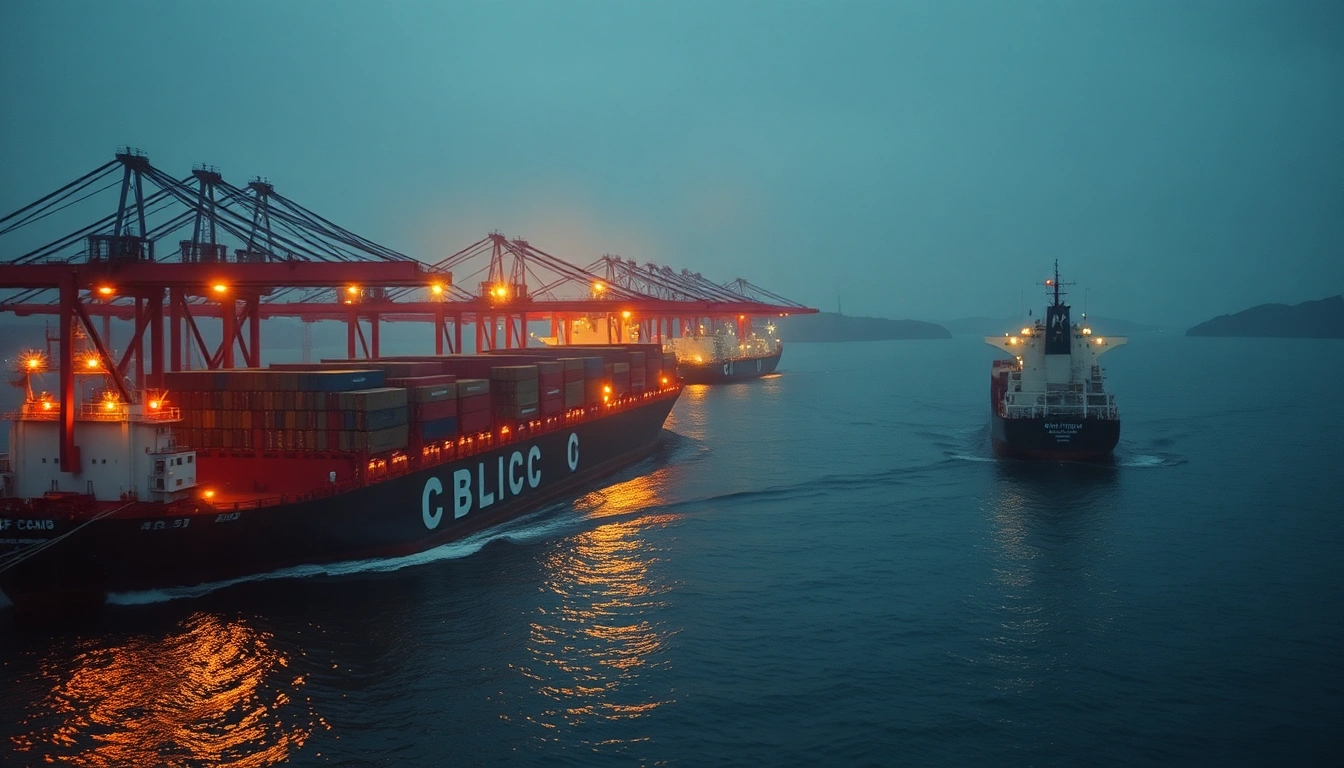
- What Happened: VLCC ton-mile demand surged 9% week-over-week as winter Red Sea risk forced Cape of Good Hope diversions, pushing AG-China freight to $2.85/bbl and TD3C rates to $92,000/day, even as 4.97% Treasury yields capped WTI at $82.37.
- Hidden Mechanism: Longer voyages tie up vessel capacity, effectively shrinking the global tanker fleet by 12% and amplifying freight rate volatility—a classic ton-mile multiplier.
- Capital Transmission: Higher freight costs are compressing refinery margins, particularly in Asia, while shipping equities attract yield-seeking capital away from 4.97% Treasuries.
The Cape Diversion: Why VLCC Rates Are Breaking Out
VLCC spot rates have surged to $92,000/day on the TD3C route (AG-China) and $78,000/day on TD15 (WAF-China), the highest since January 2026, as tankers avoid the Red Sea and Suez Canal. In plain English: each diverted voyage adds 14 days and 6,500 nautical miles, effectively removing 12% of the global VLCC fleet from active service.
The Ton-Mile Multiplier: How Geopolitics Reshapes Shipping Economics
Ton-miles—cargo volume multiplied by distance—are the hidden lever in shipping economics. A standard AG-China voyage is 6,500 nautical miles; via the Cape, it’s 13,000. This doubling in distance doesn’t just add time; it absorbs vessel capacity, tightening supply. With the VLCC orderbook at just 4.2% of the fleet, the effective supply shock is acute.
The real squeeze isn’t in crude prices—it’s in the physical availability of tankers. While WTI trades at $82.37, freight costs per barrel have jumped to $2.85, eroding refinery margins by $1.10/bbl for Asian buyers. The market is underestimating how quickly ton-mile demand can outstrip supply when the fleet is this tight.
Why Gold Retreated to $3,573 and How It Links to Shipping
Gold’s drop to $3,573 is a direct consequence of the 4.97% 10-year Treasury yield, which raises the opportunity cost of holding non-yielding assets. This same yield wall is capping crude prices, as higher borrowing costs slow global growth and oil demand. The shipping market, however, is insulated because freight is a cost passthrough—higher rates are absorbed by cargo owners, not tanker operators.
Positioning & Liquidity Map: Who Is Trapped?
Crude oil longs are trapped: they’re betting on supply disruptions, but 4.97% yields are capping upside. Refiners are squeezed between high freight costs and soft product cracks—Asian margins have fallen to $4.50/bbl, down from $7.20 in October. Meanwhile, shipping equities are attracting capital from yield-starved investors, with FRO up 18% in a month. The marginal buyer is the freight derivative trader, while forced sellers are refiners locking in losses.
Forward Scenarios & Probability Matrix
| Scenario | Implied Probability | Key Trigger / Level | Expected Asset Reaction |
|---|
| Base Case | 55% | VLCC rates hold above $85,000/day; WTI $78-86 | Freight rates stable; FRO and DHT outperform |
| Bullish Tail | 25% | Red Sea closure extends beyond Q1 2027 | TD3C rates spike to $120,000/day; crude at $95 |
| Bearish Stress | 20% | Red Sea de-escalation; OPEC+ cuts 1M bpd | Freight rates drop 30%; FRO falls 15% |