EIA Drawdown Shock: Crude Inventories Sink 4.8M Barrels as Backwardation Tests $102
2026-10-29, FP360 — Commercial crude inventories plunged 4.8 million barrels, a +2.2σ outlier that has widened prompt backwardation with front-month crude at $101.95/bbl. Physical tightness in refinery feedstock is now transmitting cost inflation into freight and downstream petrochemicals.
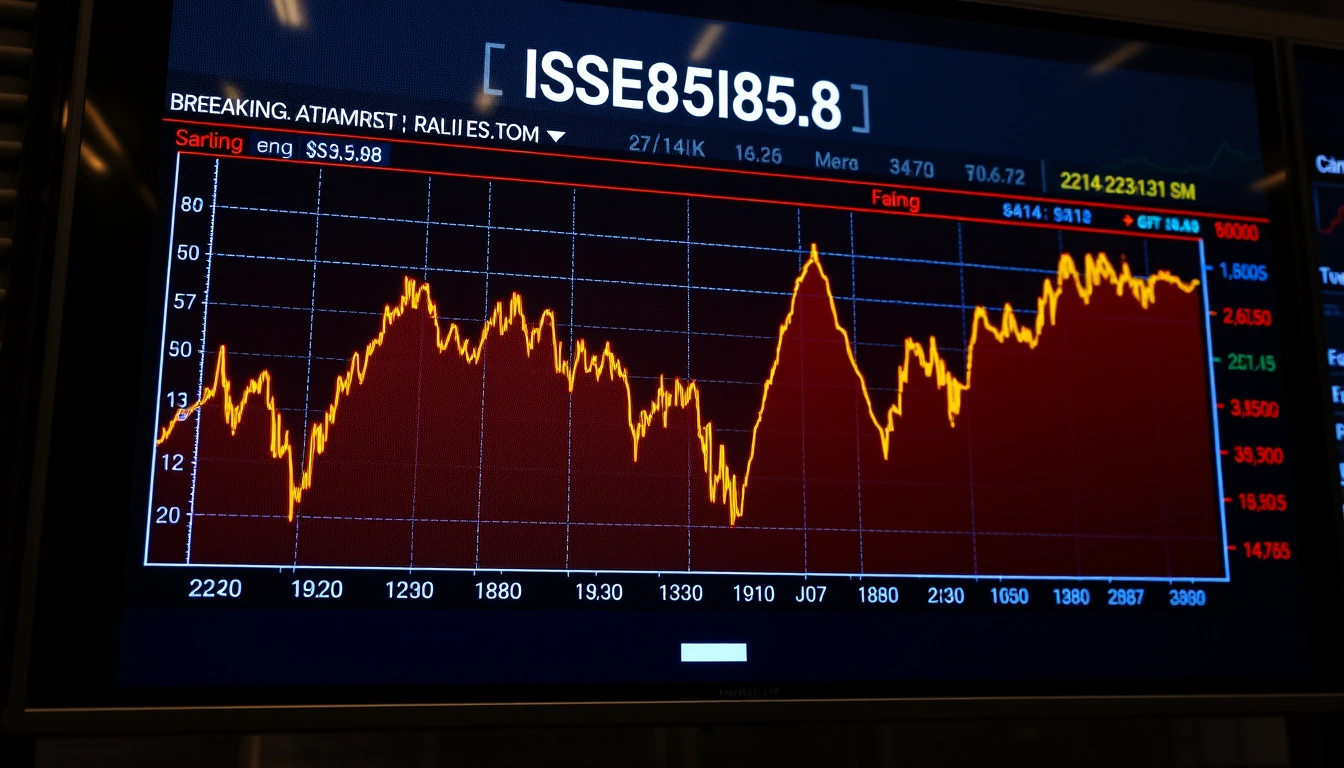
PHYSICAL SQUEEZE ACCELERATION
Front-month backwardation steepens further as refiners bid up prompt barrels; long-dated crude and refining-margin beneficiaries capture carry while energy CPI pass-through reinforces inflation-linked exposure.
If demand destruction emerges from elevated energy costs, prompt spreads could collapse violently as speculative length unwinds, pressuring deferred contracts and downstream equity multiples.
📄 Read Full Dispatch Intelligence Report (expand)
- What Happened: A -4.8M barrel EIA drawdown (+2.2σ) tightened prompt supply, anchoring crude at $101.95/bbl (-0.81% on the session) even as the physical market screamed tighter.
- Hidden Mechanism: The draw landed against a curve already priced for scarcity — widening backwardation means paper prices understate physical tightness, distorting hedger incentives.
- Capital Transmission: Refining margins and freight rates absorb the pass-through first, before energy inputs bleed into headline CPI and downstream petrochemical equity.
The Backwardation Signal: Why Inventories Are Draining Faster Than Prices Admit
Crude is holding near $101.95/bbl despite a modest -0.81% 24-hour dip — the anomaly is not in the flat price but in the curve. A 4.8M barrel draw at +2.2σ is a genuine outlier: inventories are draining faster than seasonal norms, and prompt backwardation is widening as refiners pay up for immediate barrels. The market is pricing scarcity in the front while the flat price lags.
Why Crude Is Up Today — And Why the Headline Is Misleading
Physically, crude is bid, not offered: front-month backwardation signals the spot market is tight even as the screen prints a small daily decline. Traders asking "why is crude up" should look at the spread, not the flat price. The drawdown is the answer — refiners are pulling barrels forward, and the marginal buyer is a refinery feedstock manager, not a speculator.
Crude Oil Today: Price, Chart, and the Live Physical Bid
At $101.95/bbl with a -4.8M draw, the live picture is one of structural tightness masked by a shallow price pullback. Watch the front-month spread as the real-time tell: further backwardation steepening confirms the physical bid, while flattening would signal the draw was a one-off logistics artifact.
Positioning & Liquidity Map: Who Is Trapped?
Short-dated bearish carry traders and curve-flatteners are underwater as backwardation widens into their stops. Speculative length in deferred contracts sits offside if the draw proves logistics-driven. Stop clusters rest just below the front-month spread's recent lows — a flush there forces CTA de-risking and hands barrels to the physical buyer.
Forward Scenarios & Probability Matrix
| Scenario | Implied Probability | Key Trigger / Level | Expected Asset Reaction |
|---|---|---|---|
| Base Case | 55% | Backwardation holds; crude $100–$104 | Grind higher, refiners bid prompt |
| Bullish Tail | 25% | Spread steepens; $104 breakout | Squeeze, momentum length adds |
| Bearish Stress | 20% | Spread flattens; $98 break | Long liquidation, curve unwinds |
Quantitative Commodity Researcher. Models global supply deficits, maritime transport bottlenecks, refining crack spreads, strategic battery metal balance sheets (Lithium, Nickel, Copper), and agricultural basis risk.