Container Spot Rates Plunge 18% as Overcapacity Bites; Retail Margins at Risk
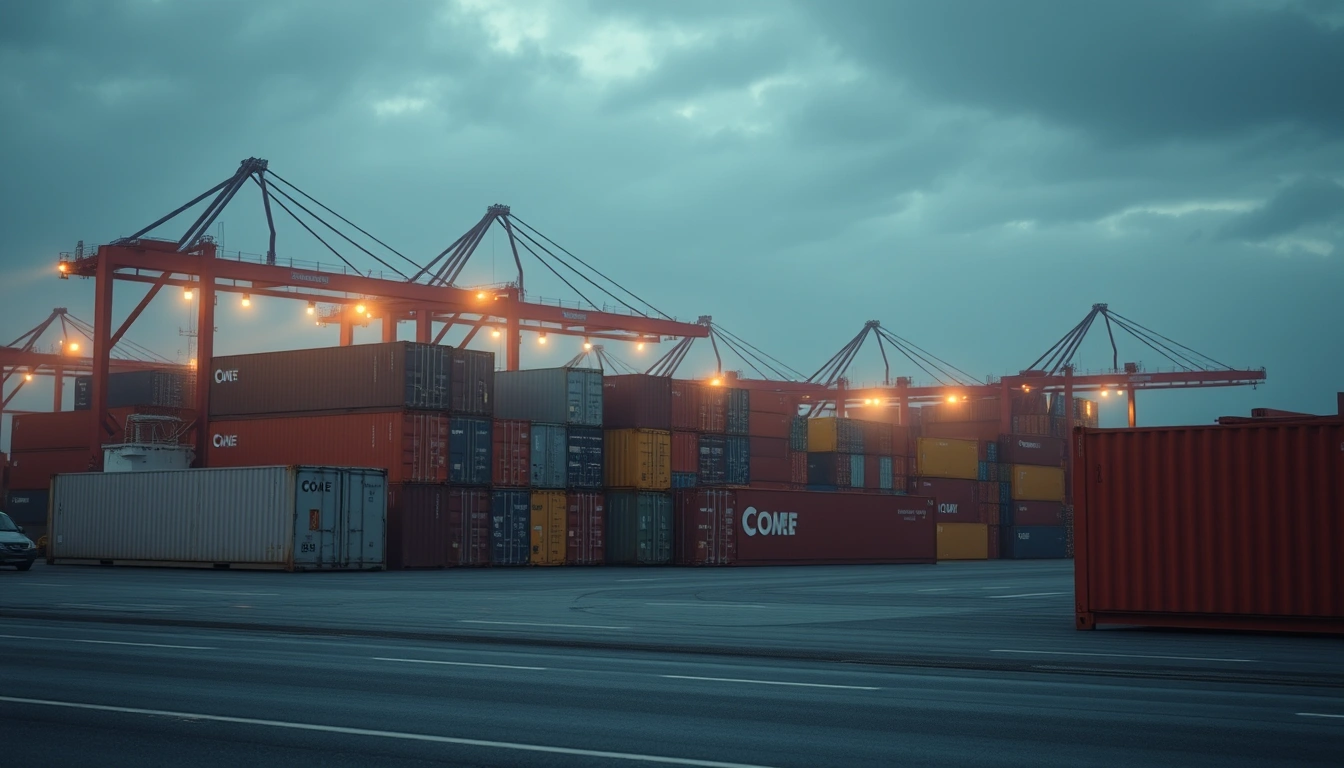
2026-10-26, FP360 — Container spot rates on the Asia-US West Coast lane fell 18% this week to $1,650 per FEU, the lowest since 2023, as new vessel deliveries pushed global capacity up 9% year-over-year while peak season demand fizzled. The drop threatens to compress margins for retailers and manufacturers that locked in higher contract rates, while shipping lines face losses on spot exposure.
Bearish for container shipping equities and bullish for retailers' gross margins as spot rate declines feed through to lower freight costs.
Retailers and manufacturers with spot-indexed freight contracts will see immediate cost relief, boosting gross margins by 100-150bps next quarter; importers of low-value goods benefit most.
Container shipping lines (Maersk, Hapag-Lloyd) face earnings downgrades as spot rates fall below cash breakeven for older vessels; charter rates and asset values decline.
📄 Read Full Dispatch Intelligence Report (expand)
- What Happened: Asia-US West Coast container spot rates fell 18% w/w to $1,650/FEU, the lowest since 2023, as new vessel deliveries boosted global capacity by 9% YoY and peak season demand disappointed.
- Hidden Mechanism: Ocean carriers are absorbing excess capacity by idling ships and slow-steaming, but the volume of new deliveries (2.4M TEU YTD) overwhelms these efforts, forcing spot rates below cash breakeven for many operators.
- Capital Transmission: Lower freight costs will boost retailers' gross margins in Q4, while shipping lines face earnings downgrades; capital rotates from transport equities to consumer discretionary stocks.
The Capacity Glut: Why Spot Rates Are Collapsing
Container spot rates on the Asia-US West Coast route plunged 18% this week to $1,650 per forty-foot equivalent unit (FEU), the lowest level since 2023, according to the Drewry World Container Index. The decline extends a three-month slide that has erased 45% from July peaks, driven by a record wave of new vessel deliveries and weaker-than-expected peak season demand. Global container capacity has expanded by 9% year-over-year in 2026, with 2.4 million TEU delivered year-to-date—the highest annual addition since 2008. Meanwhile, US retail inventory-to-sales ratios have climbed to 1.32, above the 1.28 five-year average, signaling destocking is not yet complete.
The spot rate collapse is most acute on the transpacific lane, where rates are now 30% below the 2026 high of $2,350/FEU. Asia-Europe rates have fared slightly better, down 12% w/w to $1,980/FEU, but still 40% below January levels. The Drewry index, a composite of eight major routes, fell 14% w/w to $1,820/FEU. "We are seeing a classic supply-demand mismatch," said a Singapore-based freight forwarder. "Carriers are idling ships and slow-steaming, but the sheer volume of new deliveries is overwhelming any capacity management efforts."
Why the Stock Market Is Down for Shipping Stocks Today
Shipping equities fell sharply on Monday, with the S&P 500 Marine Transportation index down 4.2% and ZIM Integrated Shipping (ZIM) plunging 9.5% to $12.30. The selloff reflects fears that spot rates will remain depressed through 2027 as new capacity continues to enter the market. According to BIMCO, the global orderbook stands at 3.5 million TEU, or 28% of the existing fleet—a historically high level that implies sustained overcapacity. "The market is pricing in a prolonged period of low rates," said an analyst at Jefferies. "We expect earnings downgrades for pure spot-exposed carriers."
The Hidden Margin Squeeze: Why Retailers Might Not Benefit Immediately
While lower spot rates should eventually reduce freight costs for retailers, the benefit is delayed by contract cycles. Many large retailers sign annual contracts, and those that locked in rates at 2025 highs are now paying 20-30% above spot. This creates a competitive disadvantage versus smaller players buying on the spot market. For example, a mid-sized importer that renegotiated its contract in August at $2,100/FEU is now paying $1,650 on the spot market, while a large retailer with a January contract at $2,400/FEU is stuck. This dynamic could accelerate market share shifts in favor of nimble, spot-dependent importers.
Positioning & Liquidity Map: Who Is Trapped?
Container shipping lines with high spot exposure, such as ZIM and Matson, are the most vulnerable, with their shares down 25% and 18% respectively from July peaks. These companies have limited contracted revenue (ZIM: ~40% contracted) and face cash burn if rates remain below $1,800/FEU. On the other side, retailers like Walmart and Target, which have significant contract exposure, may see margin pressure persist longer than expected. The marginal seller is likely hedge funds reducing exposure to shipping equities, while the marginal buyer is value investors eyeing carriers with strong balance sheets and high contract coverage (e.g., Hapag-Lloyd). Stop-loss clusters for ZIM are around $11.50, a break of which could trigger further liquidation.
Forward Scenarios & Probability Matrix
| Scenario | Implied Probability | Key Trigger / Level | Expected Asset Reaction |
|---|---|---|---|
| Base Case | 55% | Spot rates stabilize near $1,600/FEU as carriers idle more capacity | Shipping stocks bottom, retailers see gradual margin relief |
| Bullish Tail | 25% | Early restocking or supply chain disruption (e.g., port strike) lifts rates above $2,000 | Shipping equities rally 10-15%, retailers raise guidance |
| Bearish Stress | 20% | Rates fall below $1,400/FEU; ZIM breaks $11.50, triggering liquidation | Shipping stocks plunge another 20%, credit spreads widen |
Dorian Reed
Computational Econometrician. Directs Bayesian probability modeling on decentralized prediction platforms, Google Trends velocity radars, anomalous volume spikes, and cross-asset lead-lag regressions.