[COMMODITIES]⏱ 3 MIN READ • 2026-10-17 10:00:24 UTCJSON API [RAW]
Silver Structural Deficit Widens as Solar PV Demand Absorbs 12% of Global Supply
Silver's 2024 structural deficit expands to 215 Moz as solar photovoltaic manufacturing consumes 12% of global mine supply. With above-ground inventories at 1.2 Bln Oz and falling, the market faces a seventh consecutive annual shortfall.
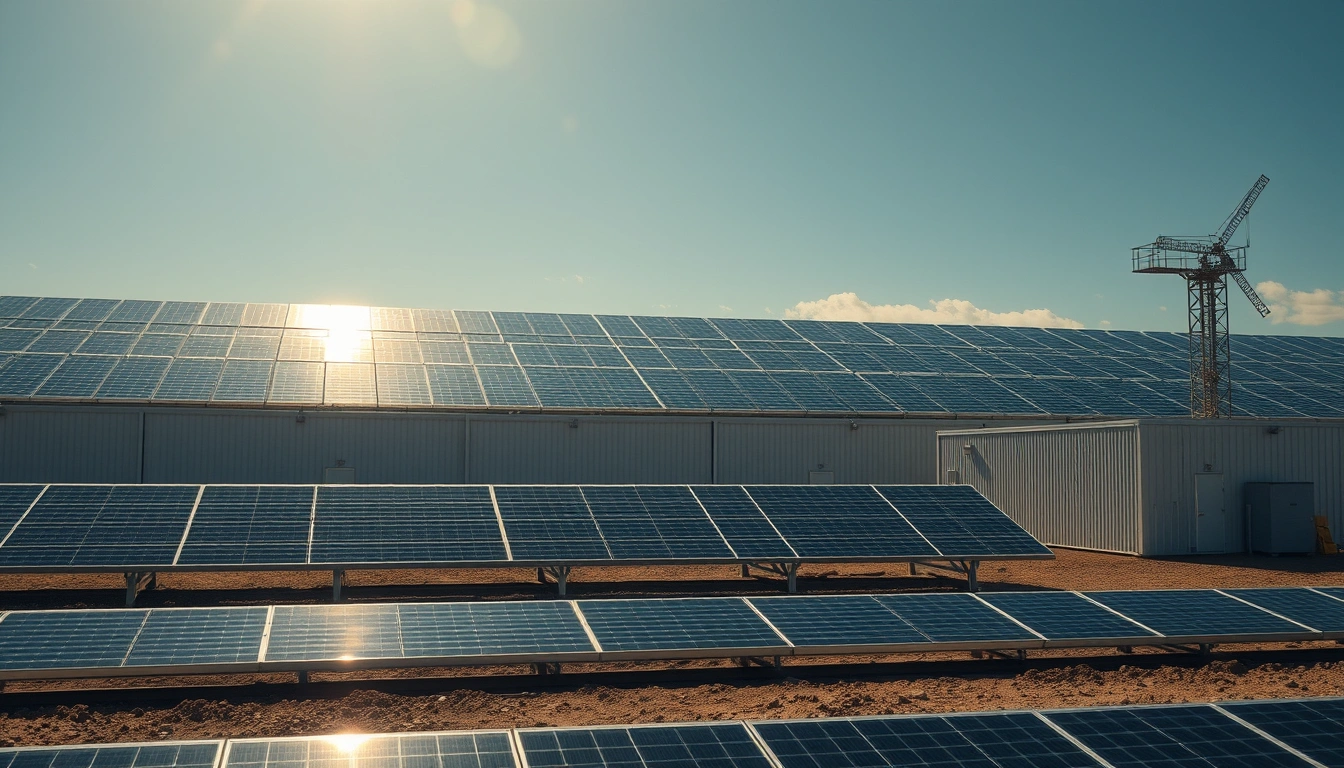
PHOTO: FINPULSE 360 MARKETS BUREAU
⚡ EXECUTIVE 30-SECOND INVESTOR MATRIX
🎯 THE SIGNAL
Bullish silver: deficits and falling inventories support a test of $32/oz, with industrial demand inelastic to price.
📈 BULLISH VECTORS
Silver miners (e.g., First Majestic, Pan American) benefit from higher prices; industrial demand for solar pastes remains robust.
📉 BEARISH VECTORS
A slowdown in solar installations or substitution with copper paste could pressure prices; rising rates strengthen USD, hurting silver.
⚠️ PRIMARY RISK TRIGGER:Federal Reserve policy surprises and China's solar installation pace are key volatility catalysts.
📄 Read Full Dispatch Intelligence Report (expand)
Supply-Demand Imbalance
Global silver demand reached 1,210 Moz in 2024, while mine supply totaled 830 Moz, yielding a 380 Moz deficit before recycling. Recycling added 165 Moz, leaving a net deficit of 215 Moz, the seventh consecutive annual shortfall. Solar PV demand alone accounts for 145 Moz (12% of mine supply), up 25% YoY. Above-ground inventories now stand at 1.2 Bln Oz, down 22% from the 2020 peak, covering only 1.2 years of demand.
Solar Demand Dynamics
Solar PV installations are projected to grow 30% in 2024 to 450 GW, driven by China (240 GW), EU (80 GW), and US (40 GW). Silver usage per GW varies: PERC cells use ~10 Moz/GW, TOPCon ~12 Moz/GW, and HJT ~15 Moz/GW. As TOPCon and HJT gain market share, silver intensity increases. Our model suggests solar demand will reach 160 Moz by 2025, growing at 12% CAGR.
Price and Positioning
Spot silver trades at $28.5/oz, up 18% YTD. The gold/silver ratio at 78 remains above the historical average of 65, implying silver is undervalued. Managed money net long positions in COMEX silver futures total 45k contracts, up from 20k in January. The 50-day moving average at $27.8 provides support, while resistance lies at $30.0. Implied volatility (30-day) is 28%, below the 2023 average of 32%.
Investment Implications
We forecast a 2025 deficit of 230 Moz, with prices averaging $32/oz. Key risks include a potential slowdown in China's solar buildout (policy support waning), substitution to copper paste (accelerating in low-efficiency cells), and a hawkish Fed (stronger USD). Silver miners with low all-in sustaining costs (AISC) below $15/oz offer leverage.