Reserve Scarcity Stalks Fed QT Exit as ON RRP Buffer Hits Zero
With overnight reverse repo balances effectively depleted, further balance-sheet runoff now drains bank reserves directly. The 3.05% reserve-to-GDP ratio is approaching the 2019 scarcity trigger, forcing the Fed to consider an early end to QT.
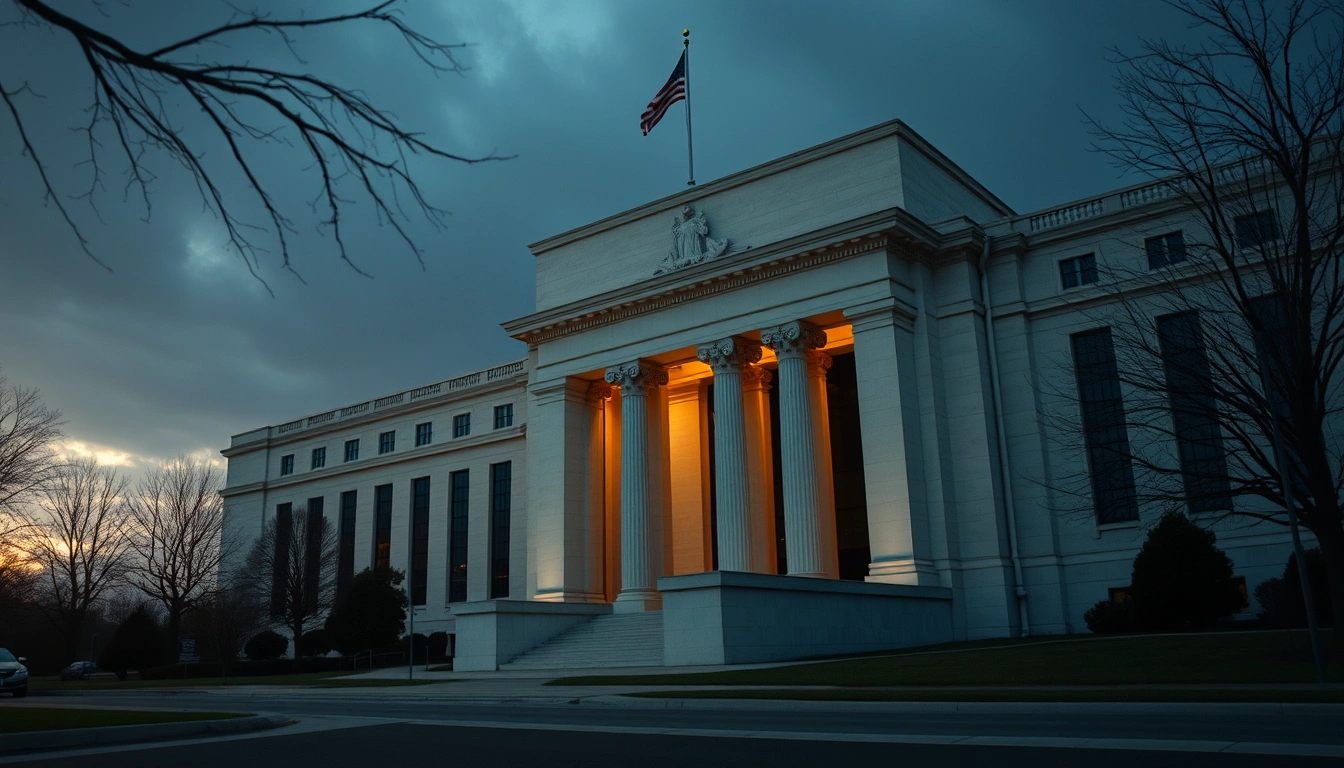
Short-end funding stress will likely steepen the 2s10s curve and widen swap spreads, favoring duration flatteners and front-end volatility hedges.
Front-end Treasuries (1-3y) benefit from early QT taper and potential IOER cut, compressing yields by 15-20bp.
Regional bank equities face margin compression from rising deposit costs and reduced reserve buffers.
📄 Read Full Dispatch Intelligence Report (expand)
Reserve Drain Accelerates as ON RRP Buffer Exhausts
Overnight reverse repo (ON RRP) balances have collapsed to $4.2 billion, down from $2.1 trillion at the peak in 2023, effectively removing the Fed's buffer for absorbing excess liquidity. With the ON RRP facility no longer absorbing liquidity, every dollar of Treasury settlement now draws directly from bank reserves. Since June 2026, reserves have fallen $480 billion to $3.62 trillion, or 3.05% of GDP, the lowest since January 2020. The Fed's balance sheet stands at $5.9 trillion, down $2.3 trillion from the 2022 peak, as runoff continues at $50 billion/month in Treasuries (no MBS runoff for six months).
Funding Markets Show Early Fraying
The Secured Overnight Financing Rate (SOFR) fixed at 4.32% on October 16, 5 basis points above the interest on reserve balances (IORB) rate of 4.27%. This SOFR-IORB spread, though narrower than the 10bp spike in September, signals tightening collateral. The SOFR-IORB gap has averaged 3.2bp in October, up from 1.8bp in July. Meanwhile, the 10-year Treasury yield has risen to 4.48%, and the 2-year to 4.02%, steepening the 2s10s curve to 46bp (from 28bp in August). The 30-year yield sits at 4.72%, with the term premium (10y) at 105bp. The effective federal funds rate (EFFR) remains at 4.33%, within the target range of 4.25-4.50%.
2019 Redux? Comparing Scarcity Metrics
Current reserve-to-GDP of 3.05% is closing in on the 2.9% level reached in September 2019, when repo rates spiked to 10%. However, the Fed has since established the Standing Repo Facility (SRF), which was tested in June 2026 with a modest $12 billion take-up. The SRF's existence may cap extreme spikes, but stigma remains. Cross-currency basis swaps show stress: the 3-month EUR/USD basis widened to -28bp (from -18bp in July), and USD/JPY basis to -42bp. Bank reserves are also unevenly distributed; the largest 25 banks hold 68% of reserves, leaving smaller institutions vulnerable.
Policy Options and Market Implications
With the FOMC meeting on November 5-6, 2026, the Committee is expected to debate a QT taper. A reduction in the monthly runoff cap from $50 billion to $25 billion could begin in December, potentially ending QT by Q1 2027. The Fed may also lower the IORB rate by 5bp to discourage hoarding. For markets, an early QT exit would support front-end Treasuries (1-3y yields could fall 15-20bp relative to the long end), steepening the curve further. Credit spreads could tighten, but regional banks (KRE index) face margin pressure from higher deposit costs. The dollar may weaken as liquidity concerns ease, with DXY possibly testing 98.50 support.